Australia’s State Capacity: A Literature Review
By PETER BOWERS[1] and JOSEPH WALKER[2]
This is a working paper. It was originally prepared in preparation for Joseph Walker's podcast conversation with Steven Hamilton and Richard Holden.
Introduction
While most Australians do not realise it, their government is incredibly effective by global standards. We wanted to know why. That is, we wanted to account for Australia’s high level of state capacity.
State capacity refers to the ability of a government to achieve its policy goals. It applies to all areas of public policy, from defence and crisis management to social welfare and economic management.
Political parties may disagree about where and to what extent the government should play a role in society, but almost all would agree that if the government is going to play a role in a particular area, it should at least do so competently.
Much of the public debate and academic literature on Australia’s government focuses either on how Australia’s state capacity is getting worse, or on how it could be significantly better (Tiernan 2012, Goldfinch and Halligan 2024).
In this working paper we attempt to take a step back and ask two fundamental questions. First: ‘How strong is Australia’s state capacity?’ And second: ‘What accounts for Australia’s level of state capacity relative to its peers?’
We find that despite popular narratives to the contrary, Australia’s government is incredibly effective by global standards, including in comparison to many developed countries. We then search the literature for explanations for Australia’s relatively high degree of state capacity.
This working paper is structured as follows:
- In the first section we summarise the political science definition of state capacity.
- In the next section we argue that Australia’s level of state capacity is impressive.
- We then devote most of this literature review to discussing some factors that may help explain Australia’s strong state capacity.
- Finally, we summarise what the Australian federal government itself currently believes are the greatest areas for improvement in state capacity.
1. Defining ‘State Capacity’ as achieving policy goals
To begin with, we follow Fukuyama (2013) in defining the ‘state’ simply as “the functioning of executive branches and their bureaucracies”. Thus in our discussion of state capacity we do not, for the most part, contemplate other branches of government (that is, the legislature or the judiciary).
Definitions of state capacity often emphasise either the ‘state’ or the ‘capacity’ dimension. The latter focus seems to be more relevant to modern capitalist democracies.
Max Weber (1946) famously defined the state minimally as “an association that claims the monopoly of the legitimate use of violence, and cannot be defined in any other manner.” (p334) However, he viewed the professional bureaucracy sitting atop this coercive power as the hallmark of the modern state (Berwick & Christia 2011).
Weber’s notion of a ‘rational bureaucracy’ both foreshadows and underpins standard definitions of state capacity. Weber (1921) argued that a rational bureaucracy was the most efficient form of human organisation, defining it by a set of conditions, including:
- the existence of a clear hierarchy,
- clearly defined responsibilities for offices,
- rule-bound operations,
- meritocratic promotion,
- expertise among officers, and
- an existence outside of politics.
The phrase ‘Weberian bureaucracy’ is now used in the political science literature to describe an ideal type of bureaucracy that lies in contrast to the feudalist system of Europe in the middle ages (Fukuyama 2013).
Berwick and Christia (2018) state ‘the most widely used conceptualizations of state capacity build either implicitly or explicitly on Weber’s portrayal of the state as an organization with the ability to make and implement rules (e.g., Besley & Persson 2011; Geddes 1994; Migdal 1988; Soifer 2008, 2013)’.
Most notably, Michael Mann’s (1986) concept of ‘infrastructural power’ built off this definition and is probably the most influential conception of state capacity in modern usage. Mann’s (1986) seminal paper ‘The autonomous power of the state: its origins, mechanisms and results’ distinguishes two dimensions of state power:
- ‘despotic power’, which refers to the range of actions the state can take without institutionalised negotiation with civil society, and
- ‘infrastructural power’, which is “the capacity of the state to actually penetrate civil society, and to implement logistically political decisions throughout the realm.”
It is this second dimension that is closer to modern definitions of state capacity.
Similar to Mann’s concept of infrastructural power, Fukuyama (2013) defines governance as “a government's ability to make and enforce rules, and to deliver services”.
While most modern definitions of state capacity use largely correspond to Mann’s ‘infrastructural’ definition, they often introduce the word ‘policy’ to describe the goals a government is pursuing. For example, Dinneco and Wang (2023):
“Following Mann (1986), we define state capacity in terms of the state’s ability to attain its intended policy goals, whether they be economic, fiscal, or otherwise. A state with high capacity is thus more likely to produce the policy outcomes that the government wants than one with low capacity (Brambor, Goenaga, Lindvall, and Teorell 2020)”.
Similarly, Williams (2020) defines state capacity as “the ability of the state bureaucracy to implement government’s policy choices”.
For the purposes of this literature review we will use a basic version of this same definition: State capacity is a government’s ability to achieve its policy goals.
The method for this literature review
The topic of state capacity is very broad, conceivably touching on a number of quite different issues such as the functioning of the public sector, the voting system, party politics, Commonwealth-state relations, and individual policy areas (e.g., defence, housing, infrastructure, etc), to name just a few.
Our search for the key literature for this review involved searching on academic databases, Google Scholar and Google, and also asking for suggestions for papers to include from a number of relevant experts. The experts we contacted included people with deep public sector experience in Australia (Ken Henry, Gordon de Brouwer, and Andrew Podger), and also academics (e.g., Alex Tabarrok and Shruti Rajagopalan).[3]
We recognise that there are many other qualified experts who, had we had more time, would have been helpful to speak to. We also recognise that there are numerous other relevant and insightful sources that we have not included here.
2. Australia has a very high level of state capacity
There are two main types of evidence that show Australia’s level of state capacity is very high, even when compared with other developed countries:
- global indices that measure the state capacity of a country; and
- case studies of where the Australian government’s state capacity has been particularly impressive.
The next two subsections here survey the literature on each of these types of evidence.
Then, in a third subsection we argue that Australia’s very effective government is particularly impressive because it is not simply due to the state being given vast financial resources. In this sense, Australia’s state capacity is efficient.
Global indices of state capacity place Australia among top performers
In this section we summarise the evidence from four respected indices of a country’s state capacity. These indices are typically created using a combination of objective data (e.g., how frequently censuses occur) and subjective data. The subjective data generally involves large numbers of experts answering a series of questions related to each country. While they rely on human judgement, the number of people involved and the predetermined rubric of questions gives them a level of reliability. Some indices are created using inputs from other indices.
Fortunately, most measures of state capacity give broadly similar results. O’Reilly and Murphy (2022) find their state capacity indices have correlations greater than 80% with two other indices of state capacity, and a correlation of about 90% with a third.
Varieties of Democracy-based Index
O’Reilly and Murphy (2022) combine various indicators from the Varieties of Democracy (V-Dem) dataset to create an index of state capacity that covers 1789 to 2018—a much longer historical timespan than most indicators. They combine 6 indicators from the Varieties of Democracy data set (Coppedge et al) that measure:
- State authority over territory – Over what percentage of the territory does the state have effective control?
- Rigorous and impartial public administration – Are public officials rigorous and impartial in the performance of their duties?
- Rule of law – To what extent is the rule of law upheld? (This includes measures of compliance with high court and judiciary, high court independence, and executive respects constitution among others.)
- Share of spending on public goods – Considering the profile of social and infrastructural spending in the national budget, how ‘particularistic’ or ‘public goods’ are most expenditures?
- Educational equality among citizens – To what extent is high-quality basic education guaranteed to all, sufficient to enable them to exercise their basic rights as adult citizens?
- Fiscal source of revenue – On which of the following sources of revenue does the central government primarily rely to finance its activities?
For the year 2023, Australia is placed 4th out of 174 countries, being beaten by Germany (1st), Estonia (2nd) and Denmark (3rd). These numbers come from the index that was updated following the initial publication (O’Reilly 2024). Australia’s placement is relatively consistent, having also been 4th in the year 2000, at that time behind Denmark (1st), Switzerland (2nd) and Sweden (3rd).
Hanson and Sigman’s index of state capacity
Hanson and Sigman (2021) developed a ‘State Capacity’ index by combining 21 different indicators related to state capacity. In 2015, the latest year for which their data is available, Australia places 10th out of the 177 countries included. Australia is significantly above the averages of the ‘high income countries’, as well as Europe, the US and UK. The countries that are placed higher than Australia are, from the highest: Denmark, Norway, Austria, Belgium, Sweden, Finland, Germany, Switzerland, New Zealand (Herre and Arriagada 2023). Australia did even better in the year 2000 when it placed 4th, behind Denmark, Finland and Sweden.
This index includes some inputs that are clearly relevant to state capacity, such as the Political Risk Services Group’s ‘International Country Risk Guide (ICRG)’ measure of ‘Bureaucratic Quality’, which creates an index by asking a large number of experts to rate a series of pre-set questions. While subjective, the measure is clearly relevant.
Other more objective measures of state capacity they use may be less appropriate for our purposes because they start to delve into policy decisions. We are defining state capacity as a state’s ability to achieve its policy goals regardless of what those goals are. Problematic measures include tax rates and spending on the military and police—for example, (log) Military Personnel per 1,000 in population, (log) Police Officers per 1000 in population, Taxes on Income as % of Taxes, Taxes on International Trade as % Revenue, Total Tax Revenue as % GDP.
As the section on government efficiency below shows, Australia’s strong state capacity is particularly impressive given it is not a high taxing nation compared to some OECD peers. So Australia’s score in the index would likely be even higher if these problematic objective measures of state capacity were not included.
The International Civil Service Effectiveness Index (InCiSE)
The International Civil Service Effectiveness (InCiSE) Index placed Australia 5th in the world, down slightly from 3rd in 2017. Australia had high scores in regulation, and crisis and risk management, and regulation.
InCiSE was replaced and ‘refreshed’ in 2024 by the Blavatnik Index of Public Administration. As we detail in Appendix A, we believe that the Blavatnik Index is a poorer measure of state capacity than the previous InCiSE because in order to increase the number of countries covered from 38 to 120 the updated index appears to use less relevant data. In any case, Australia still performed well in the Blavatnik Index, ranking 8th out of 120 countries.
World Bank Worldwide Governance Indicators (WGI)
One of the most well known measures relevant to state capacity are the 6 Worldwide Governance Indicators from the World Bank (O’Reilly and Murphy 2022). The indicators that the literature regards as particularly relevant to state capacity are ‘government effectiveness’, where Australia is ranked at the 93.9th percentile in 2023 of the 214 countries surveyed, as well as ‘regulatory quality’ (99.5th percentile), ‘control of corruption’ (95.8th percentile), and ‘rule of law’ (92.0th percentile). (The remaining indicators are ‘political stability and absence of violence/terrorism’ (79.6th percentile), and ‘voice and accountability’ (96.1th percentile).
In terms of methodology, the World Bank website from which the data can be downloaded notes: ‘The WGI are based on existing data sources produced by more than 30 think tanks, international organizations, nongovernmental organizations, and private firms around the world. … The data reflect the diverse views of tens of thousands of survey respondents and experts worldwide.’ (World Bank Group 2025)
There are impressive case studies of Australian state capacity
The pandemic response
In their book Australia’s Pandemic Exceptionalism, economists Steven Hamilton and Richard Holden provide a comprehensive treatment of how Australia’s high level of state capacity enabled its relatively successful response to the Covid-19 pandemic.
Three metrics help to quantify the success of Australia’s response. First, Australia’s employment-to-population ratio returned to its pre-crisis level after 12 months (whereas the United States hadn’t recovered four years later). Second, by March 2022, after Australia reopened its borders and ended lockdowns, its Covid-19 death rate was one-tenth that of the United States (on a per capita basis). Third, Australia’s net debt was basically unchanged before and after the pandemic—19.2% of GDP in both 2018-19 and 2022-23.
In terms of Australia’s economic response to the pandemic, Hamilton and Holden regard JobKeeper, the cornerstone of the government’s economic response, as being particularly well-designed. In contrast to the United States, which focused on stimulus payments, JobKeeper was designed to maintain the links between employers and employees—arguably a more-appropriate response to a crisis like a pandemic in which fiscal stimulus would not be able to have its usual effects due to lockdowns.
JobKeeper was enabled to a large degree by Australia’s economic infrastructure, especially Single Touch Payroll (‘STP’), which Hamilton and Holden describe as the ‘unsung hero’ of the pandemic. STP is the Australian Taxation Office’s (ATO) electronic reporting system. It finished rolling out about six months before the pandemic began.
STP integrates with payroll and accounting software used by most businesses. It works invisibly and without any effort on the part of the business. Its intended purposes were to reduce the reporting burden on businesses and ensure tax compliance.
During the pandemic, the ATO leveraged STP to verify employee retention and wages at the same fortnightly frequency at which it provided the JobKeeper payments. This was essential to the delivery of JobKeeper, in large part because it enabled the ATO to mitigate fraud and assure the Australian government that JobKeeper could be delivered with high integrity.
In contrast, the United States lacked an equivalent of STP, which is partly why it wasn’t able to mount an equally effective economic response.
Apart from STP, the ATO was also highly efficient in handling superannuation withdrawals. In total, one in six working-age Australians used this facility during the pandemic. To quote Hamilton and Holden:
“[D]uring the pandemic the government for the first time granted broad early access to people’s superannuation savings. The policy was announced on 22 March 2020 and, less than one month later on 20 April, participants could log onto their myGov account, tick a few boxes, and then within just three days $10 000 would appear in their bank account. The system processed more than 520 000 withdrawal requests in the first three days. And the government wasn’t only implementing this program but a raft of others simultaneously." (p139)
As much as the pandemic revealed Australia’s high level of state capacity, it also exposed ways in which it could be improved. Hamilton and Holden catalogue several mistakes on the part of the Department of Health and health regulators (principally the TGA and ATAGI). For example, Australia failed to successfully automate contact tracing through the use of mobile phone data, and was slow to approve vaccines. Furthermore, Australia’s medical-regulatory system was initially resistant to rapid antigen tests because they did not have the same level of accuracy as PCR tests, despite the fact they could be conducted at home (rather than a clinic) and had significant practical benefits.
The worst mistake, however, was the vaccine procurement strategy, in which Australia initially preferred just two vaccines (the University of Queensland and AstraZeneca vaccines) rather than taking out ‘insurance’ by procuring up to, for instance, eight vaccines (the number that was sponsored by Operation Warp Speed in the US). The errors in vaccine procurement meant that for more than two months in 2021 Australia had the worst vaccination rate of any OECD country, and probably cost Australia about 10% of its GDP, making it the largest public policy mistake in Australian history.
Nevertheless, Australia quickly caught up to the vaccination rates of its OECD peers, with a mostly effective vaccine roll-out, largely administered by state governments.
Overall, Hamilton and Holden conclude that “Australia has a very high-functioning administrative state” and that “Looking back on the role played by all of our institutions during the pandemic, we are left with one simple takeaway: they served us well”.
This conclusion that Australia’s strong state capacity was one of the main drivers of its relatively effective pandemic response is consistent with recent research from economists Omberg and Tabarrok (2022). Using a cross-country data set, they find that almost no form of pandemic preparedness helped ameliorate or shorten the pandemic. This included investments in pandemic preparedness and also cultural values—like cultural collectivism, willingness to sacrifice, and trust in government—that could be thought of as a type of pandemic preparedness. The one factor they highlight that did improve pandemic performance was “general state capacity, as opposed to specific pandemic investments.”
Digital government
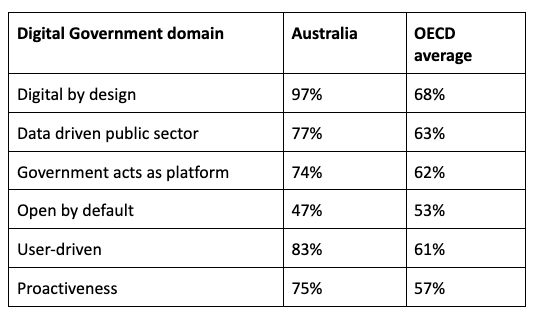
Australia ranked fifth in the most recent OECD Digital Government Index in 2013, far above the average and beating Canada, Finland, France and Sweden. The only countries to beat Australia were (in order): Korea (1st), and Denmark, UK, and Norway (4th). The DGI assesses countries’ digital government by looking at the degree to which they have the necessary foundations in place to be able to leverage data and technology to deliver a whole-of-government and human-centric digital transformation of the public sector. Australia’s scores against the 6 domains were:
This strong digitisation has transferred to strong customer satisfaction. As the Thodey review (2019) describes:
"Strong performance in global rankings is matched by high levels of customer satisfaction with Australian Government services nationally. Medicare and Centrelink make up approximately 80 per cent of Australian Government interactions with Australians, and have customer satisfaction rates at 84 per cent and 75 per cent respectively. These rates are comparable with the NSW Government’s Customer Satisfaction Index and those of leading private sector companies…”
The Thodey review goes on to give some striking examples of Australia’s strong performance at digitisation:
- "~98% of Medicare claims are now processed online. That’s 1.1 million transactions a day. Money arrives back in your bank account as quickly as your bank can process it…"
- "It takes as little as 15 seconds to pass through a SmartGate at an Australian International airport. SmartGates use artificial intelligence facial recognition technology and processed more than 25 million passengers in 2017–18…"
- "~96% of MyTax lodgements take less than 30 minutes, 97% of individual income tax returns are lodged electronically, ~95% of returns are processed without human intervention."
The Australian state is efficient as well as competent
In addition to it being competent, there is evidence that Australia also has an efficient government, meaning that its high state capacity is not merely due to the state being given large financial resources.
Stone (2014) uses the World Bank’s ‘Government Effectiveness’ measure that “captures perceptions of the quality of public services, the quality of the civil service and the degree of its independence from political pressures, the quality of policy formulation and implementation, and the credibility of the government’s commitment to such policies”.
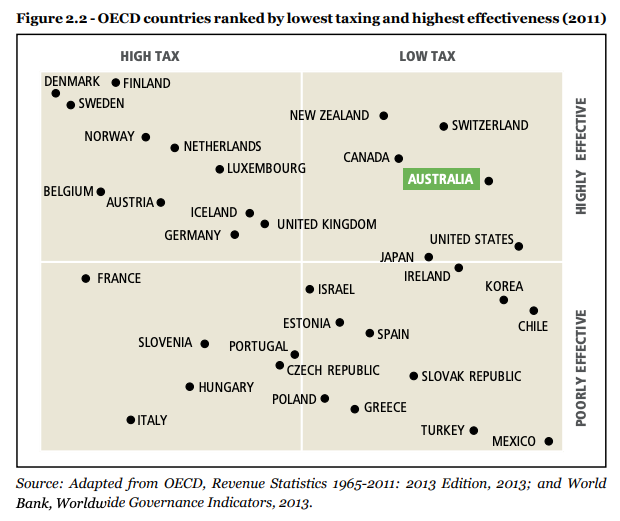
He finds Australia is the only OECD country to be both in the top ten most effective governments and the bottom five lowest taxing governments for the period he examines, 2011. He illustrates this with the scatter plot below, arguing that countries closest to the top right corner are the most efficient and Australia is therefore the second most efficient OECD country, with Switzerland in first place.
It would be valuable to repeat this analysis using more current data to see if the result still holds given the original analysis used data from 2011. For the purposes of this literature review, we have not attempted to do this. However, we provide here a summary of recent OECD publications on how Australia’s tax rate compares to other OECD countries.
In their Revenue Statistics 2024 – Australia publication, the OECD reports Australia’s tax to GDP ratio was 29.4% in 2022, which is below the OECD average of 33.9% in 2023. This places Australia as the 29th highest tax-to-GDP ratio country out of the 38 OECD member countries (the bottom 24th percentile). It was very similar in the year 2000 at 30.4%.
Another relevant comparison point is how tax on labour income compares to other OECD countries. In their Taxing Wages 2024 publication, the OECD uses the measure of the ‘tax wedge’, which they define as ‘the tax on labour income, which includes the tax paid by both the employee and the employer’ (with any Family Benefits taken out of the total tax paid amount). They find that for a single worker, Australia’s tax wedge is almost in the lowest 20% of OECD countries (the bottom 21st percentile), and for the family Australia’s tax wedge is in the lowest 40% of OECD countries (the bottom 37th percentile). This suggests Australia’s taxes on incomes are lower than OECD peers for both single workers and families. However, the difference with other OECD countries is considerably smaller for the family because Australia’s tax system does not incentivise having kids as much as other OECD countries.
The exact numbers are as follows:
- For the single worker, the tax wedge in Australia was 29.2% in 2023 compared to the OECD average of 34.8%. This means Australia had the 30th lowest tax wedge among the 38 OECD member countries, one place below the USA.
- For the family, the tax wedge in Australia was 22.7% in 2023 compared to the OECD average of 25.7%. This means Australia had the 24th lowest tax wedge among the 38 member countries, actually much higher than the USA, which was at 30th place.
3. Why does Australia have a high state capacity?
In the previous section we summarised the evidence for Australia having an impressive level of state capacity in comparison to most countries. In this section, we turn to the question of why.
Answering this question from the literature alone is not straightforward. This is for two reasons. First, most public policy discussion in Australia is not focused on this question, but rather is focused on the question of how Australia’s state capacity could be even better. Second, much discussion of government effectiveness in Australia does not assume that Australia’s government is effective at all, much less seeks to explain its effectiveness.
We approach the question in two ways. First, we look at the literature on Australia’s government and review some of the various features that are recognised as contributing to state capacity (though rarely under that name). We then look to the literature on state capacity, and consider how Australia fares in terms of some of the factors that are believed to lead to strong state capacity.
The question of state capacity could conceivably touch on a range of sources related to the public sector, public policy and government generally. We summarise the views of a selection of sources, and recognise that there are numerous other relevant and insightful sources that we have not included.
In their review of state capacity, Berwick and Christia (2018) describe three main dimensions of state capacity that we will refer to at points and that provide helpful framing for this section. The dimensions are:
- Extractive capacity: ‘The ability to gather resources’ (e.g., a national income tax).
- Coordination capacity: The ‘capabilities of state agents to organize collective action’ both between bureaucrats themselves and between bureaucrats and citizens. In short, the ability to run ‘professionalized, Weberian bureaucracies’.
- Compliance capacity: The ability of state leaders to secure compliance—from the public, civil society, the public service, etc—to their goals.
Approach 1: Reasons from the literature on Australia’s government
Cabinet government
Weller (2021) argues one of the strengths of Australia’s political system is the decision-making process itself, in particular ‘cabinet government’. He defines cabinet government broadly as being the entire process through which collective purpose is developed and maintained by the central members of the core executive. It therefore includes smaller meetings of, say, the Prime Minister and their staff or a small meeting of Ministers, as much as it includes formal cabinet meetings. It also includes the rigorous process that cabinet government forces on the bureaucracy in preparing cabinet documents, and listening to feedback from different departments. Weller quotes a Canadian official:
“I don’t care if ministers actually read the memorandum or not. I care that the system has subjected it to the discipline of critique and comment and improvement and that our thinking has improved as a result. That doesn’t necessarily mean sitting round a table in a meeting room.” (quoted in Weller 2018, 154)
Weller provides a few reasons for the effectiveness of cabinet government. It involves centralised decision-making that provides stability and certainty across government, yet is also flexible enough for policy decisions to be made at a fast pace when required. Also, by having multiple Ministers with different responsibilities, the decisions can be made on a large number of policy areas simultaneously. Finally and perhaps most importantly, cabinet government forces decision-makers to grapple with the differing views of an issue across the community. As Weller says:
“…Prime ministers must blend their multiple dilemmas to provide a coherent decision that combines political support, administrative feasibility and programmatic sense. The balance will slip from one to another, but they ignore any one of them to their peril. The benefit of well-managed cabinet government is that it is flexible enough to manage the trade-offs.”
A culture of obedience to institutional authority
There is a large literature linking the culture of a society to the development of institutions and state capacity more generally (e.g., Greif 1994, Alesina and Guiliano 2015). In terms of relevant cultural values in Australia, John Hirst (2004) points out that despite Australians despising politicians and authority figures with airs about them, the Australian people are unusually obedient to institutional authorities, and willing for the government to have a high level of interference in people’s lives. Hirst lists numerous examples: Australia was the first country to make wearing seatbelts compulsory, the first to make bike helmets compulsory for not only motorbikes but also pushbikes, the first to introduce compulsory breath tests of drivers, the most extreme in actions to discourage smoking, and the first country to introduce compulsory voting. Hirst sums this culture up with, “Australians are suspicious of persons in authority, but towards impersonal authority they are very obedient.”
Recent data supports this argument. The OECD’s Survey of Drivers of Trust in Institutions 2024 finds that in Australia, around 47% of people have a high or moderately high level of trust in their national government, compared to an average of 39% for the 30 OECD countries surveyed.
This obedience to impersonal authority and institutions is plausibly a driver of Australia’s high state capacity, consistent with Berwick and Christia's (2018) ‘compliance capacity’.
A culture of relying on the state
Culture may be a driver of Australia’s state capacity in other ways. Keith Hancock famously observed:
“Australian democracy has come to look upon the State as a vast public utility, whose duty it is to provide the greatest happiness for the greatest number...To the Australian, the State means collective power at the service of individualistic 'rights'. Therefore, he sees no opposition between his individualism and his reliance upon Government.”
Mirroring this, Alan Davies (1964) observed that “Australians have a characteristic talent for bureaucracy.”
This is in stark contrast to the US. American public policy academic Donald Kettl (2015) argued that one of the causes of America’s poorer state capacity compared to comparable developed countries is that culturally there is a more extreme “dislike of government and of those who perform government services” in the US.
It is plausible that Australia’s state capacity is strong because culturally there is a belief in a highly functioning state in a way that there is not in other liberal democracies like the US. This culture provides Australia with both compliance capacity and coordination capacity.
A relative lack of adversarial legalism and prescriptive legislation
American administrative law academic Nicholas Badgley (2019) describes one of the major constraints on bureaucratic effectiveness in the US as the “procedure fetish” where strict procedural rules are created to give the state legitimacy and to provide protection and accountability against factional interests. He argues that while these strict rules are created with good intentions, they frequently over-burden the bureaucracy, reducing its effectiveness and consequently actually undermining its legitimacy.
Pahlka and Greenway’s (2024) excellent diagnosis of how to fix state capacity issues in the US affirms Badgley’s argument pointing out that bureaucrats themselves seek refuge behind increasing layers of procedure—both legal procedure and various bureaucratic guidelines—that allow them to show that things have been done ‘by the book’. However, these increasing layers of procedure undermine the state’s ability to operate effectively.
They give the example of the US Department of Defense’s procurement framework, which was originally 7 pages but is now over 2,000 pages and has resulted in the Department to its own admission taking so long to go through the process for purchasing ships, planes and weapons that they are frequently obsolete before they are delivered.
Pahlka and Greenway describe two major causes of the procedure fetish that are particularly relevant to this review. First, US legislators have a particularly strong distrust of the bureaucracy and consequently have been inclined to write legislation in a particularly prescriptive way. For example, the US Paperwork Reduction Act was enacted in 1980 to reduce the paperwork burden on citizens but is widely seen to have increased the administrative admin burden on departments and actually undermined departments’ ability to improve user experience.
Second, the United States’ particularly extreme ‘adversarial legalism’ has contributed to this accretion of government policy and process: “When government is sued or an agency called before a Congressional committee, it generally defends itself on the basis of having followed the proper procedure. But parties seeking advantage find in those procedures opportunities to attack or at least slow down government action. The attacks spur bureaucracies towards ever-more detailed, voluminous procedures, repeating the cycle.” The attacks also contribute to a culture of extreme risk aversion that further drives reliance on detailed procedure.
In these two drivers of the procedure fetish we perhaps have another reason for Australia’s relatively strong state capacity. In terms of the first reason, Australians do not have as strong a distrust of impersonal institutions as the US and do not have legislation that is as prescriptive as the US Paperwork Reduction Act. In terms of the second reason, Australia has a far less adversarial legal system than the US.
High levels of risk aversion and unnecessary procedures may well act as a constraint on the speed and effectiveness of government in Australia. However, it seems plausible that relatively speaking these issues are less severe, which may well be a major reason for Australia’s impressive state capacity.
Federal structure
Anne Twomey and Glenn Withers (2007) argue one of the drivers of Australia’s successful political system is that it is a federation of states, and that modern movements toward centralisation are concerning. In their view, federalism holds multiple benefits including:
- Providing greater checks on power by limiting the size of any one government and increasing scrutiny of government action. This also results in reform proposals being more measured.
- Upholding the ‘principle of subsidiarity’, which states that matters should be dealt with by the lowest level of government practicable. This allows policies to be tailored to the needs of people and communities they directly affect. Australia has wide differences in culture, demography, resources, industry, climate and geography, so accommodating these differences is valuable.
- Creating healthy competition between jurisdictions to improve their performance. They argue this increases efficiency, which explains why federations have proportionately fewer public servants and lower public spending than unitary states.
- Generating innovation and experimentation between states as they compete with one another. This then allows adoption of good ideas across other states as well.
- Enabling stronger economic growth than unitary states. The report uses regression modelling to attempt to calculate the income benefit in the half-century from 1950. The report finds Australia’s per capita income due to higher economic growth between 1950 and 2006 is $4,507 higher as a result of its federalist structure. They argue this is a “major achievement” that “reflects the continuing legacy to Australians today of the nation’s founding fathers.”
It is possible that one of the drivers of Australia’s relatively strong state capacity compared to other developed countries is the federalist government structure.
Australia’s relative strength in using evidence-based policy
Gary Banks (2009) points to several examples of where a commitment to publication of evidence and use of evidence has resulted in particularly effective public policy making in Australia. While his primary focus is arguing that evidence-based policy approach should be more ubiquitous in Australia, his arguments do suggest that Australia may be a relatively high performer in evidence-based policymaking compared to other countries. This would likely contribute to Australia’s state capacity both in terms of the legitimacy it provides the government, as well as in the government's ability to make good decisions.
Banks uses the example of tariff reform in Australia. The Tariff Board, established in 1921, was required by legislation to publish a public report on the effects of tariffs. This report initially focused on the effects on the particular industries affected, but later expanded to economy-wide effects. The expansion drove tariff reform because the losers under the original higher tariff regime were primary exporting industries—the “farmers and miners”—who started to appreciate the extent of the implicit taxes and costs they were bearing. Evidence that they were losers made them a powerful force for reform where they had not been previously.
Banks provides several other examples of where Australia has a particularly strong record in terms of evidence-based policy. Australia has led the world in developing some methodologies like ‘general equilibrium’ modelling of the ‘direct and indirect effects’ of policy changes throughout the economy.
Australia has been well served by the Australian Bureau of Statistics, and the Productivity Commission. In particular, the Productivity Commission’s annual publication, the Report on Government Services (ROGS). The ROGS provide a detailed breakdown of the effectiveness and efficiency of government services. In relation to this Banks says, “Foreign government officials visiting Australia have often expressed astonishment at what we have achieved.”
While not perfect, Australia also has a history of independent policy research that may in fact be considerably better than that available in other countries. For example, Banks describes learning to his surprise that Productivity Commission research on gambling was being used extensively for policy debate in the US, despite there being a large quantity of gambling research in the US. The reason for this was that most of the US research was sponsored by advocate groups—either industry on one side, or ‘community and church groups’ on the anti-gambling side. This meant it was difficult to know what research to trust given ‘he who pays the piper, calls the tune.’ Banks provides several other examples from Australia where two different pieces of policy research on the same topic have come to opposing conclusions depending on the sponsor.
Banks is very clear that Australia could do much better at being committed to evidence based policy, particularly in some areas (e.g., he says Australia does relatively few ‘randomised trials’ than other countries). However, his various examples suggest that in some respects Australia may actually have a better culture and record of evidence based policy than other comparable countries. This may help explain Australia’s relatively strong state capacity.
Approach 2: Reasons from the state capacity literature
In this section we describe a selection of factors that contribute to strong state capacity as discussed in the state capacity literature. For each factor we discuss how Australia compares to other countries and whether this could be a contributing factor to Australia’s strong state capacity.
Extractive capacity
A potential driver of a nation’s state capacity—as well as a potential measure of state capacity—is its ability to collect taxes from citizens and businesses. Berwick and Christia (2018) called this the ‘extractive capacity’ domain of state capacity. The method of extraction, as well as the amount extracted matters, because taxes like a national income tax are administratively much harder to extract than, for example, customs duties (Dinecco and Wang 2022).
In the section on Australia’s ‘Government efficiency’ above, we summarised OECD reports that suggest relative to other OECD countries Australia is not a particularly high taxing country. This could be interpreted to mean that Australia’s state capacity is lacking in this domain, or that extractive capacity is not a contributing factor to Australia’s relatively strong state capacity. However, such an interpretation is problematic.
A large share of the state capacity literature is focused on how historically powerful states emerged from pre-industrial societies (Johnson and Koyama 2017), and often with an interest in the implications of this for developing countries (Khemani 2019). As Johnson & Koyama (2017) point out, while OECD countries today tax between 20-40% of GDP, preindustrial societies rarely succeeded in taxing more than 5% of GDP. So while a state’s ability to collect taxes may be relevant in a pre-industrial society, it is less relevant to modern Australia. In short, it is unlikely Australia faces similar issues today in collecting taxes to the issues pre-industrial societies faced.
A more likely force limiting tax rates in Australia is culture. As Alesina et al (2001) argue, there are cultural differences between the US and Europe that mean the US does not have a European-style welfare system. More than half of countries in the OECD are European countries. So similarly, cultural differences between Australia and Europe are more likely the main drivers of Australia’s somewhat lower tax rates compared to the OECD—for example, how much involvement Australians believe the government should have in their lives, how generous welfare should be, etc.
Compensation of public servants
Berwick and Christia (2018) point to the remuneration of employees in the bureaucracy as a potential driver of state capacity as it both allows the state to attract high ability employees (who have options in the private sector), and also can help motivate employees. This could well be a contributing factor to Australia’s strong state capacity.
Australia’s public service is relatively well paid compared to other comparable countries. For example, the median salary for an entry level role in the UK is around £24,480 in 2024, which is equal to approximately 49,000 AUD (Institute for Government 2024). The median salary for an entry level role in the Australian Public Service is 70,489 AUD in 2023 (APSC Remuneration Data 2023). At the more senior levels the difference is even greater, with Australian secretaries often being paid two-and-a-half times their US and UK counterparts (Bartos 2024).
Stable political system
Podger (2015) points out that providing stability is a key role of the government and the public sector in particular. Government plays a role in “setting the legal and economic framework within which individuals and private organisations can go about their lives and businesses with confidence.” This is closely related to the cooperation and coordination domains of state capacity.
Judith Brett (2019) argues that among other things, Australia’s system of compulsory voting, which is somewhat unusual globally, has contributed to Australia’s relatively stable political life and far lower levels of political polarisation than, for example, between Republicans and Democrats in the US. Australia has also had the advantage of being a relatively cohesive society, which is at least partly due to having fewer cultural differences between states (compared to the United States) and not having a history of civil war or similar divisions. These factors may well be driving factors behind Australia’s relatively stable political and public policy climate, which could contribute to Australia’s relatively strong state capacity.
4. What are the current reform priorities across the Australian government today?
A review of state capacity across Australia would not be complete without acknowledging the various reform efforts currently underway. For brevity, we focus on the federal government and review three important documents that provide an overview of government-wide reform efforts there, though acknowledge there are similar efforts across state and territory governments as well.
The Thodey Review
The Thodey Review was an independent review of the Australian Public Service (APS) commissioned by the Turnbull Government in 2018. Its Report was delivered in 2019. All governments—regardless of political leaning—have supported implementation of its recommendations.
To place it in its historical context, the Thodey Review is one of the most substantive reviews of the APS conducted since the Coombs Royal Commission of 1976, which ushered in a ‘second era’ in the APS’s history. This second era was characterised by “significant decentralisation; devolution of budgets; increased power to separate departments, agencies and authorities; and greater responsiveness to ministers”. (p41)
The Thodey Review contemplates what a third era might look like, and notes that the four decades following the Coombs Royal Commission, while encompassing a period of ‘high-quality policy advice’ and ‘strong bureaucratic-political alignment’ (p41), have also resulted in a narrow focus on short-term delivery, efficiency, and that ‘too much devolution results in poorly integrated advice and support to the Government on complex government priorities’ (p42).
The Review argues that the APS is unprepared to meet Australians’ expectations in the future given 7 key challenges, which give rise to 7 corresponding reform priority areas. Namely, the APS:
- Lacks a clear unified purpose.
- Is too internally focused.
- Has underinvested in digital services.
- Has failed to manage and invest strategically in its people.
- Is too fragmented and siloed.
- Lacks a united leadership team.
- Lacks the mechanisms to change quickly and keep up with a changing world.
To highlight just two problematic examples identified by the Report, it found that ‘about 40 per cent of APS employee time is currently spent on highly automatable tasks such as data collection and processing’ (p25) and that ‘fewer than 41 per cent of Australian citizens were satisfied with the way democracy works in Australia in 2018 — down from 86 per cent in 2007’. For comparison, ‘Eighty per cent of the world’s democracies are distrusted by most of their citizens (p46).’ As an example of how trust is crucial for service delivery, the Report noted that "more than 2.5 million Australians opted out of the My Health Record amid trust issues in data security" (p46).
The Report provided 40 recommendations to make the APS fit for purpose for the decades ahead, ranging from undertaking regular capability reviews to build capacity and accountability (Recommendation 2a) to building data and digital expertise across the service by applying the ‘APS Professions Model’ and creating centres of excellence (Recommendation 15).
The Review suggested 6 key targets and outcomes to hold the APS accountable for its transformation:
- more than 90% Government priorities delivered
- more than 80% Public satisfaction with APS services
- Australia to be ranked in the top-5 globally for ‘Ease of Doing Business’
- Cap APS operating expenditure as a percentage of government spend
- Double scores for public trust in the APS
- more than 80% Staff engagement
It’s worth noting that in the 10 years to the Review, there had been at least 18 significant other reviews of different aspects of APS operations. While many of these reviews prompted improvements to the APS, the fact that the Thodey Review identified similar problems to those previously identified underscores the difficulty of implementing and realising public sector transformations.
The APS Reform Report
The performance of the APS in completing the recommendations from the Thodey review (and other change management priorities) are tracked in the APS Reform Annual Progress Report. The 2024 APS Reform Report states that: "Of the program’s 59 initiatives, around one-third are substantively complete and the remaining are progressing through design, planning and delivery stages.”
Outcome reporting in the document is very high-level and focused on the reform priorities, which makes it difficult to infer a great deal about Australia’s level of state capacity and how it is changing. Nonetheless, the existence of such a report and the level of transparency it implies is likely further evidence of the strong state capacity across the APS.
The existence of the report is also a sign of the bipartisan commitment of various federal governments to reform. While the Thodey review was initiated by the Turnbull government, implementation has continued under the Albanese government.
The State of the Service Report
The Australian Public Service Commission publishes the annual State of the Service report, which is in some sense an annual report for the operations of the entire federal public service. The most recent report, State of the Service Report 2023-24, gives an update on progress of public service reform. A selection of significant milestones referenced include:
- Amending the Public Service Act 1999 to include “stewardship” as an additional APS Value
- Establishing an in-house consulting model, Australian Government Consulting
- Developing the Culturally and Linguistically Diverse Employment Strategy and Action Plan
The report does not really attempt to quantify the performance of the APS, which is perhaps understandable given how widely the goals of individual agencies vary, and how difficult many of them are to quantify. It does provide some statistics though, for example on the employee make-up of the service (e.g., 185,343 employees, 60% female, 3.4% First Nations, etc).
The report also provides some statistics from the census of APS employees, e.g., 82% of employees satisfied with their non-monetary employment conditions, 91% ‘happy to go the extra mile at work when required’, and 87% ‘felt a strong personal attachment to the APS’.
Sources
1. Defining ‘State Capacity’ as achieving policy goals
Berwick, E., & Christia, F. (2018). State capacity redux: Integrating classical and experimental contributions to an enduring debate. Annual Review of Political Science, 21, 71-91.
Besley, T., & Persson, T. (2011). Pillars of prosperity. Princeton University Press.
Brambor, T., Goenaga, A., Lindvall, J., & Teorell, J. (2020). The lay of the land: Information capacity and the modern state. Comparative Political Studies, 53(2), 175-213.
Dincecco, M., & Wang, Y. (2023). State capacity. In The Oxford handbook of historical political economy.
Fukuyama, F. (2013). What is governance? Center for Global Development, Working Paper 314, January 2013.
Goldfinch, S., & Halligan, J. (2024). Reform, hybridization, and revival: the status of new public management in Australia and New Zealand. Public Management Review, 26(9), 2542–2560. https://doi.org/10.1080/14719037.2024.2329770
Mann, M. (1986). The autonomous power of the state: Its origins, mechanisms, and results. In J. Hall (Ed.), States in history (pp. 109-136). Oxford University Press.
Tiernan, A. (2012), Advising Australian Federal Governments: Assessing the Evolving Capacity and Role of the Australian Public Service. Australian Journal of Public Administration, 70: 335-346. https://doi.org/10.1111/j.1467-8500.2011.00742.x
Weber, M. (1921). Economy and society: A new translation (2019). Harvard University Press. (Original work published 1921)
Weber, M. (1946). From Max Weber: Essays in sociology.
Williams, M. J. (2021). Beyond state capacity: Bureaucratic performance, policy implementation, and reform. Journal of Institutional Economics, 17(2), 339-357.
2. Australia has a very high level of state capacity
Arriagada, P., & Herre, B. (2023). State capacity. Data adapted from Jonathan Hanson and Rachel Sigman, various sources. Retrieved from https://ourworldindata.org/grapher/state-capacity-index
Bastian, H., & Arriagada, P. (2023). State capacity. Data adapted from Jonathan Hanson and Rachel Sigman, various sources. Retrieved from https://ourworldindata.org/grapher/state-capacity-index
Coppedge, M., Gerring, J., Knutsen, C. H., Lindberg, S. I., Teorell, J., Marquardt, K. L., Medzihorsky, J., et al. (2019). V-Dem methodology v9. V-Dem Working Paper (forthcoming).
Hamilton, S., & Holden, R. (2024). Australia’s Pandemic Exceptionalism: How we crushed the curve but lost the race.
Hanson, J. K., & Sigman, R. (2013). Leviathan’s latent dimensions: Measuring state capacity for comparative political research. Work Paper, 2011 Annual Meeting of the American Political Science Association, Seattle, WA. Retrieved from https://papers.ssrn.com/sol3/papers.cfm?abstract_id=1899933#
Hanson, J. K., & Sigman, R. (2021). Leviathan's latent dimensions: Measuring state capacity for comparative political research. The Journal of Politics, 83(4), 1495–1510. https://doi.org/10.1086/715267
Hechter, M., & Brustein, W. (1980). Regional models of national political economy. Theory and Society, 9(2), 285-332.
OECD. (2024). Taxing wages 2024 – Australia. Retrieved from https://www.oecd.org/content/dam/oecd/en/topics/policy-issues/tax-policy/taxing-wages-australia.pdf
OECD Centre for Tax Policy and Administration. (2024). Revenue statistics 2024 – Australia. Retrieved from https://www.oecd.org/content/dam/oecd/en/topics/policy-sub-issues/global-tax-revenues/revenue-statistics-australia.pdf
OECD. (2023). 2023 OECD Digital Government Index. OECD Public Governance Policy Papers. Retrieved from https://www.oecd.org/content/dam/oecd/en/publications/reports/2024/01/2023-oecd-digital-government-index_b11e8e8e/1a89ed5e-en.pdf
O'Reilly, C., & Murphy, R. H. (2022). An index measuring state capacity, 1789–2018. Economica, 89(355), 713–745. https://doi.org/10.1111/ecca.12398
O'Reilly, C., & Murphy, R. H. (2024). State capacity index (an updated data set). Retrieved from https://colinworeilly.com/state-capacity-index/
Stone, C., Cheyne, E., Wilkinson, M., Kasbekar, N., & Beverley, S. (2014). False economies: Unpacking public service efficiency. Centre for Policy Development.
Tucker Omberg, R., & Tabarrok, A. (2022). Is it possible to prepare for a pandemic? Oxford Review of Economic Policy, 38(4), 851-875. https://doi.org/10.1093/oxrep/grac035
Thodey, D., Carnegie, M., Davis, G., De Brouwer, G., Hutchinson, B., & Watkins, A. (2019). Our public service, our future: Independent review of the Australian public service.
World Bank Group. (2025). Worldwide governance indicators. Retrieved from https://www.worldbank.org/en/publication/worldwide-governance-indicators
3. Why does Australia have a high state capacity?
Alesina, A., & Giuliano, P. (2015). Culture and institutions. Journal of Economic Literature, 53(4), 898–944. https://doi.org/10.1257/jel.53.4.898
Alesina, A. F., Glaeser, E. L., & Sacerdote, B. (2001). Why doesn’t the US have a European-style welfare system? Brookings Papers on Economic Activity, 2001(2), 187–278.
Banks, G. (2009). Evidence-based policy making: What is it? How do we get it? ANU Public Lecture Series, presented by ANZSOG, 4 February. Productivity Commission, Canberra.
Bartos, S. (2024, November 21). Secretaries’ salaries: How Australia compares to the US and UK. The Mandarin. Retrieved from https://www.themandarin.com.au/281845-secretaries-salaries-how-australia-compares-to-the-us-and-uk/
Berwick, E., & Christia, F. (2018). State capacity redux: Integrating classical and experimental contributions to an enduring debate. Annual Review of Political Science, 21, 71-91.
Brett, J. (2019). From secret ballot to democracy sausage: How Australia got compulsory voting. Text Publishing.
Davies, A. (1964). Australian Democracy.
Davis, G., De Brouwer, G., & Hutchinson, B. (2019). Our public service, our future: Independent review of the Australian public service.
Greif, A. (1994). Cultural beliefs and the organization of society: A historical and theoretical reflection on collectivist and individualist societies. Journal of Political Economy, 102(5), 912–950. https://doi.org/10.1086/261959
Hancock, W. K. (1930). Australia. Retrieved from https://archive.org/details/in.ernet.dli.2015.172679/page/n147/mode/2up
Hirst, J. (2004). The distinctiveness of Australian democracy. Senate Occasional Lecture Series, Parliament House, 10 September. Retrieved from https://www.aph.gov.au/binaries/senate/pubs/pops/pop42/hirst.pdf
Johnson, N. D., & Koyama, M. (2017). States and economic growth: Capacity and constraints. Explorations in Economic History, 64, 1-20. Retrieved from https://devf21.classes.ryansafner.com/readings/Koyama-Johnson-2016.pdf
Kettl, D. F. (2015). The merit principle in crisis. Governance: An International Journal of Policy, Administration, and Institutions, 28(4), 511-522. Retrieved from https://www.volckeralliance.org/sites/default/files/attachments/The Merit Principle in Crisis - The Volcker Alliance.pdf
Khemani, S. (2019). What is state capacity? World Bank Policy Research Working Paper (8734).
O'Reilly, C., & Murphy, R. H. (2022). An index measuring state capacity, 1789–2018. Economica, 89(355), 713–745. https://doi.org/10.1111/ecca.12398
O'Reilly, C., & Murphy, R. H. (2024). State capacity index (an updated data set). Retrieved from https://colinworeilly.com/state-capacity-index/
OECD. (2024). Survey of drivers of trust in institutions 2024. Retrieved from https://www.oecd.org/en/publications/oecd-survey-on-drivers-of-trust-in-public-institutions-2024-results_9a20554b-en.html
Podger, A. (2015). Innovation in the public sector: Beyond the rhetoric to a genuine ‘learning culture’. In J. Wanna, H.-A. Lee, & S. Yates (Eds.), Managing under austerity, delivering under pressure: Performance and productivity in public service (pp. 119-130). ANU Press. Retrieved from http://www.jstor.org/stable/j.ctt19893n9.12
Pahlka, J., & Greenway, A. (2024). The how we need now: A capacity agenda for 2025 and beyond. Niskanen Center. Retrieved from https://www.niskanencenter.org/the-how-we-need-now-a-capacity-agenda-for-2025/
Stone, C., Cheyne, E., Wilkinson, M., Kasbekar, N., & Beverley, S. (2014). False economies: Unpacking public service efficiency. Centre for Policy Development.
Twomey, A., & Withers, G. (2007). Federalist paper 1: Australia’s federal future. A report for the Council for the Australian Federation, April 2007.
Weller, P. (2021). Cabinet government: The least bad system of government? In A. Podger, M. de Percy, & S. Vincent (Eds.), Politics, policy and public administration in theory and practice: Essays in honour of Professor John Wanna (pp. 249–264). ANU Press.
4. What are the current reform priorities across the Australian government today?
Australian Public Service Commission. (2024, October). State of the service report 2023-24. Retrieved from https://www.apsc.gov.au/initiatives-and-programs/workforce-information/research-analysis-and-publications/state-service/state-service-report-2023-24
Australian Public Service Commission. (2024). APS reform annual progress report 2024. Retrieved from https://www.apsreform.gov.au/sites/default/files/resource/download/APS Reform Annual Progress Report 2024_Accessible.pdf
Thodey, D., Carnegie, M., Davis, G., De Brouwer, G., Hutchinson, B., & Watkins, A. (2019). Our Public Service, Our Future. Independent Review of the Australian Public Service. Retrieved from https://www.pmc.gov.au/resources/independent-review-australian-public-service
Appendix
Appendix A: Potential Issues with the Blavatnik Index of Public Administration 2024
The Civil Service Effectiveness Index (InCiSE) was published in 2017 (covering 31 countries) and 2019 (covering 38 countries), and then replaced by the Blavatnik Index of Public Administration in 2024 (covering 120 countries). The Blavatnik Index built off work completed in the InCiSE but also involved significant changes.
The Blavatnik Index appears to have some issues compared to the original InCiSE. One example is the ‘Crisis and risk management’ theme, which like all themes, is a sub-component of the overall Blavatnik Index. In the 2019 Civil Service Effectiveness Index, Australia scored 5th of countries surveyed. In the 2024 Blavatnik Index it scored 49th for the same category and was behind many low income countries that would not usually be expected to have the same level of resources to outperform a developed country so significantly. For example, India, Turkey and Mauritius at equal 5th, and also Indonesia (18th), Kenya (32nd) and Nigeria (37th).
The reason for the change appears to be that the Blavatnik index completely changed the source data for this measure:
- The 2019 InCiSE used 13 metrics from two data sources: the UN Hyogo Framework for Action monitoring reports; and the OECD’s Survey on the Governance of Critical Risk (InCiSE 2019, p21). They used this data to measure “4 themes regarding disaster risk reduction and management issues most relevant for the civil service: the degree of strategic approach to risk; the degree of preparedness; communications; and evaluation.”
- The 2024 Blavatnik Index used two sources: Global Cybersecurity Index 2020 and the Sendai Framework Monitor 2023 (Blavatnik 2024, p26)
It is not surprising Australia went from 5th in the world to 49th in the world given this change in data. The Sendai Framework Monitor includes things like “Number of deaths attributed to disasters, per 100,000 population.” As a country with a small population and a higher frequency of natural disasters such as droughts and bushfires, Australia was always going to perform poorly on such a measure.
To their credit, the Blavatnik Index report explicitly says they have attempted to not let ‘outcomes and impact (changes in society and the economy)’ affect the Index (Blavatnik 2024, p7). This is a good goal, but they appear to have not quite achieved it in this particular theme given the measure appears to fail to account for the higher underlying risk of natural disaster in Australia.
There are other surprising results in the Blavatnik sub-themes too, all of which flow into the final Blavatnik Index of Public Administration. For the ‘Technology and workplaces’ theme, 23 countries tie for 1st place including New Zealand, Uganda, Bangladesh, Honduras and the Dominican Republic, beating Australia, Singapore, the US and UK who along with many other countries are on equal 36th place. Given technology almost always has a significant cost, it is surprising that countries with a smaller government budget could so outperform countries with a larger government budget. For the ‘Procurement’ theme, the top 8 countries are, from first to eighth: Ukraine, Paraguay, Kazakhstan, Colombia, Kosovo, Estonia, Dominican Republic, and Russia, whereas Australia and the US are in equal 31st position. One can’t help but wonder if the war in Ukraine helped increase Russia and Ukraine’s scores, which might not be desirable.
Overall, it appears that in the effort to expand the number of countries covered in the Index from 38 to 120 countries, the Blavatnik Index was forced to lower the standards of relevance required for a data set to enter the index. This means that, at least for countries included in the original 38 country index, it may be better to refer to the InCiSE.
Peter Bowers works at the Australian Treasury but helped prepare this report in a personal capacity in his own time. The report does not necessarily reflect the views of the Australian Treasury or the Australian Government. ↩︎
Joseph Walker hosts The Joe Walker Podcast. ↩︎
We're grateful Ken Henry, Gordon de Brouwer, Andrew Podger, Alex Tabarrok, and Shruti Rajagopalan for providing suggestions on sources to include, though of course this doesn’t imply that they endorse the arguments in this working paper. If there are any sources that should have been included and were not, the authors take responsibility, and would be grateful to know what we’ve overlooked. ↩︎